Aug
2025
Corridor of uncertainty
DIY Investor
17 August 2025
Can an alternative interpretation of discounts identify new opportunities? By Ryan Lightfoot-Aminoff
Early August saw a thrilling, albeit rather abrupt, end to English cricket’s summer of test matches with a rollercoaster, nail-biting defeat to India to level the series. These five games were vintage test cricket and a testament to its enduring appeal as a sport and spectacle. Whilst the ebbs and flows and challenges of patience and persistence will always be the main draw behind five-day test cricket, one of the most alluring elements (well, if the evidence of our offices is anything to go by) is the statistics.
The series was a fascinating one from a statistical angle, with numerous records broken in both bowling and batting stats, as well as combined scores. Taking any one of these stats in isolation could be used to show utter dominance by either team, especially with India’s batting stats, and, yet ultimately, the test will go down in the record books as a draw, which India just snatched by the narrowest of margins on the final day.
This use of statistics arguably draws many parallels with finance, where a variety of figures can be used to make a very compelling case for or against a certain investment. In our research notes, we undertake statistical analysis on a trust’s discount in particular, usually comparing the current level to its own history, as well as how it shapes up versus its peers. However, by combining these approaches, we can tell a different story, by revealing a trust’s relative rating versus its peers’, over time. This can identify potential discount opportunities that may have been overlooked using more straightforward analysis.
Opening the bowling
To try and identify these opportunities, we h
ave gone through the AIC universe, excluding trusts with under five years’ worth of data, and sectors with fewer than three trusts or which make poor comparators, such as those including trusts currently winding up. We have compared each trust’s monthly discounts to the simple average of their peer group, looking at how this has changed over time. We have then taken the average of a trust’s relative rating over the five years and compared that to its current level. This has allowed us to identify trusts that have previously traded at a premium rating to peers, but now look cheap. Rather than looking at absolute discounts, this might be a better way to identify opportunities.
The table below shows the ten cheapest trusts on this metric across all sectors. They are ranked by the difference between the current discount to their peer group and its average over five years (given in the final column). The figure in the third column shows the five-year average rating relative to the peer group, with a positive figure indicating a premium. Using Lindsell Train as an example, it has, on average, traded at a 6.3 percentage point premium to its peer group average, yet it is currently trading 12.3 percentage points lower than this (therefore a 6% discount to the sector average). One of the most interesting trusts in this list is RIT Capital Partners (RCP). With a track record of trading on a premium, a consistent absolute discount has opened up in recent years, which is currently as wide as 27%. There has been plenty of turnover in the investment team, including the departure of the late Lord Rothschild, and so it is possible the discount will persist until a decent track record has been built up again. Notably, the recent half-year returns for the trust were positive, with particularly good returns in the directly owned private investments, three realisations being made at an average 112% premium to carrying value. Another notable entry in this table is Schroder Income Growth (SCF). SCF has performed well under the tenure of manager Sue Noffke, although in recent years the mid-cap bias has worked against it. Its discount looks attractive on both an absolute basis and in terms of its relative rating versus the sector, as our data highlights.
THE SCORECARD
| Trust | AIC sector | Average relative rating | Average versus current |
| Regional REIT | Property – UK Commercial | -10.92 | -14.87 |
| ICG-Longbow Senior Sec. UK Prop Debt | Property – Debt | -9.94 | -13.18 |
| RIT Capital Partners | Flexible Investment | 1.18 | -12.47 |
| Lindsell Train | Global | 6.34 | -12.32 |
| Baker Steel Resources | Commodities & Natural Resources | -13.21 | -10.77 |
| Canadian General Investments | North America | -20.61 | -9.8 |
| Custodian Property Income REIT | Property – UK Commercial | 6.99 | -9.22 |
| Schiehallion Fund | Growth Capital | 18.12 | -7.55 |
| Partners Group Private Equity | Private Equity | 6.05 | -6.31 |
| Schroder Income Growth | UK Equity Income | -0.31 | -6.17 |
Source: Morningstar, as at 31/07/2025
There are a number of alternative asset classes represented in this chart, including property. We see several reasons behind this, stemming from the more volatile economic environment over the past five years. The earlier part of this period was dominated by near-zero interest rates, implemented to try stimulate economic growth during the pandemic. As economies reopened, though, spending returned and led to a spike in inflation, followed by an increase in interest rates to manage this, which led to wide discounts emerging in rate-sensitive assets. Many of these discounts have been steadily closing as rates have been cut and the outlook changed, creating some volatility in relative ratings.
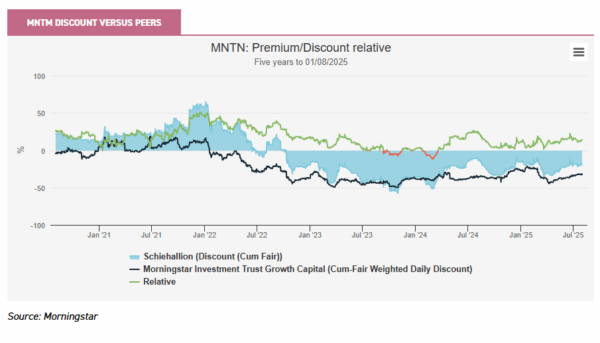
It’s a similar story with Schiehallion (MNTN) in the growth capital sector. Managed by Peter Singlehurst and Robert Natzler, MNTN owns a portfolio of stakes in late-stage private businesses. The managers take a long-term time horizon, looking to capture the potentially transformative growth opportunities in this part of the market, ahead of listing. Examples of portfolio companies include ByteDance, the owner of TikTok, and SpaceX, Elon Musk’s space exploration company. As such, MNTN offers investors exposure to private companies with high-growth potential that would otherwise be out of reach for most investors. For much of the initial five-year period, the trust traded at a wide premium to NAV, although this was partly as a result of a highly concentrated shareholder base, meaning liquidity was incredibly thin. This changed as the trust’s C shares were converted into the main share class in September 2023; however, by this point, the trust was trading at a discount to NAV, occasionally at a wider level than the sector average. The relative rating has recovered a little since, but compared to the highs at the beginning of the period, it appears relatively good value on our metrics.
Picking gaps in the field
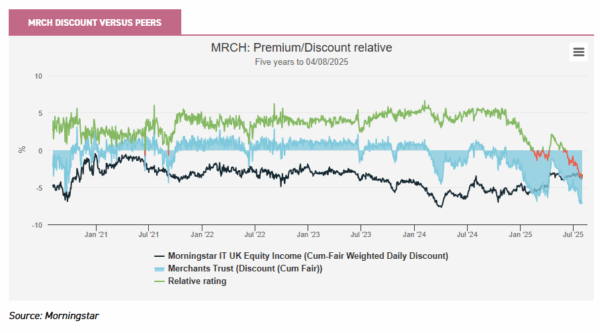
Further down the table, there are other interesting themes. One of the standout equity trusts on these metrics is Merchants (MRCH), a UK equity income trust managed by Simon Gergel and his team. The trust has traded close to NAV for much of the past five years, at an average level of -0.5% as a result of a combination of factors such as size, as it offers institutional investors good liquidity, its comparatively low costs, and above-market dividend yield. This is supported by one of the longest continuous records of dividend increases of any UK-listed company, at over 40 years. However, in 2025, the discount has twice widened significantly, first from January through to April, where it briefly narrowed later in the month, before widening sharply again to its current level of c. 7% (as at 01/08/2025). This latest move has come in a period where the broader UK equity income sector average has narrowed, from around 5% at the turn of the year to 3.4% now. Whilst this isn’t much in absolute terms, it is a notable change when considering it is an average of 18 trusts.
As a result of both moves, MRCH’s premium rating to the sector average has collapsed in the past nine months, from being 5.5 percentage points ahead in November 2024 to 3.2 percentage points behind as at the beginning of August 2025, which we have shown in the chart below. Whilst looking at MRCH’s discount in isolation might suggest value, we think it looks even cheaper when considering its relative rating.
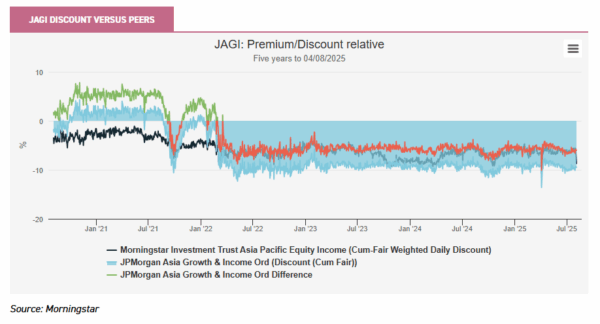
Another example is JPMorgan Asia Growth & Income (JAGI), which traded at a sustained premium early in the five-year period under consideration, whilst the sector average was at a discount. However, as both Asian and UK markets sold off in 2022 as interest rates rose to tackle inflation, and as China persisted with its zero-COVID policy, JAGI fell to a discount where it has remained since. The level of discount, though, is considerably wider than the peer group average, meaning the premium rating has all gone. This has actually widened even more in the near term, with JAGI’s discount currently six percentage points wider than the peer group average, versus a five-year average of 2.9 percentage points.
JAGI is one of a number of growth trusts that stand out in our analysis. This is a result of the changing investing backdrop and interest rate environment mentioned above. As a general rule, growth strategies perform better in lower interest rate environments but struggle in periods of higher rates. As such, many growth-focussed investment trusts now trade at discounts to their peer group, having previously traded at premium ratings earlier in the five-year period, contributing to them standing out in our analysis.
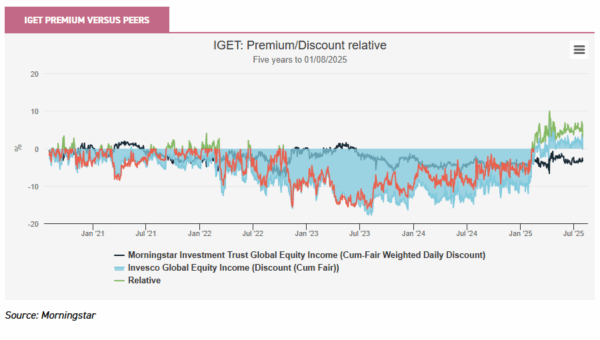
The corollary is that some value trusts that were previously trading at discounted ratings to the peer group have since recovered strongly to trade at premium ratings. One such example is Invesco Global Equity Income (IGET), which has a notable value tilt to it, as is expected of an income-focussed vehicle. The trust traded at a discount to NAV and to the sector average for much of the past five years. However, in 2025, this sharply reversed, with the trust swinging to a small premium and on a vastly better rating than the sector average. IGET absorbed the assets of the three other share classes of the Invesco Select trust during the period, and it is possible there was an overhang of stock that has now cleared. However, the near-term performance has also been very strong, which may well have contributed to its rerating. In its annual report, to 31/05/2025, the trust demonstrated a NAV TR of 11.9%, versus the MSCI World Index TR of 7.4%.
The recovery in the share price in this period is even stronger, at an impressive 24.6%. This demonstrates how closing discounts can significantly contribute to shareholder returns and why identifying discount anomalies can be useful.
Aiming for boundaries
With several growth trusts showing up as statistical anomalies in our analysis, it is worth looking into whether this could change in the future. Interest rates have remained higher and for longer than initially expected, but are slowly coming down, providing a more positive backdrop. Furthermore, there are good prospects for AI to become a dominant theme of the next few years, which would be supportive to the tech sector, which often makes up a large portion of growth portfolios.
The potential recovery of growth-focussed vehicles has been a factor behind recent changes to the portfolio of the CT Global Managed Portfolio Trust (CMPG/CMPI). CMPG/CMPI was managed by industry veteran Peter Hewitt. He has retired and handed over management duties to Adam Norris and Paul Green on 01/06/2025, although he continues to assist with a handover until October 2025. The trust is a fund of funds with two share classes, one focussed on growth and one on income. The strategy enables the managers to exploit the numerous opportunities in the investment companies universe, including the discount opportunities that exist at present. In the past 12 months, the managers added to strategies with growth exposure beyond AI, such as those focussed on the energy transition or biotech, with recent additions including Scottish Mortgage (SMT) and International Biotechnology (IBT). Growth trusts were a significant contributor to performance in the past year, with holdings in two tech trusts doing particularly well overall.
Should growth strategies stage a comeback, our analysis has identified several trusts that are trading not only at a discount to their own averages, but also on a low relative rating to their peers. Examples include Smithson (SSON), which currently trades at a discount of c. 10% (as at 07/08/2025), and 1.5 percentage points wider than the peer group average, despite historically trading at three percentage points narrower. Similarly, Montanaro European Smaller Companies (MTE) has a current discount of c. 8% with the current level about one percentage point wider than the peer group average, despite historically trading at a 2.8 percentage-point relative premium.
Umpire’s call
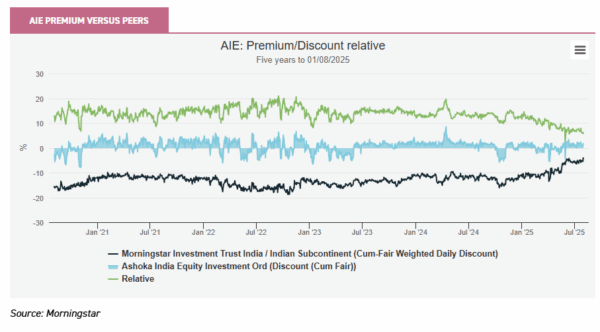
Whilst this statistical analysis has shone light on some interesting discount opportunities, it has also highlighted some other interesting relative ratings, albeit not those trading at discounts. One example is Ashoka India Equity (AIE). This small- and mid-cap focussed trust has delivered exceptional performance since its inception in 2018, which, when combined with other factors such as the managers’ skin in the game, has meant the trust has traded at a premium through much of its existence. By contrast, peers have traded at a fairly persistent discount, leaving AIE having a high relative premium rating that has averaged 13.6 percentage points over the past five years. In the past few months, though, this gap has closed significantly as two peers, in a sector of four, have had strong share price rallies. One of these is arguably related to a tender offer plus the implementation of a new policy. As such, AIE’s premium rating to peers has narrowed significantly to just 5.9 percentage points, meaning it looks very favourable taking our metrics in isolation. However, as AIE continues to trade at or above par, any mean reversion of the relative rating would have to come from its peers’ discounts widening. Given some improved performance and shareholder-friendly measures, we think there are reasons to doubt that.
And that’s over bowled
With that in mind, we believe examining a trust’s relative rating to its peer group’s can be a useful additional tool to help provide context for how a trust’s discount has evolved over time. As positivity begins to creep back into the market and investment trust sector, discounts have begun to narrow, meaning some of the heavily discounted opportunities may have gone. Whilst there remain many very attractive discount opportunities still available, using additional statistics such as our relative ratings could help investors uncover these less obvious opportunities, and lead to strong total returns should they also close and the market continue to recover after a challenging couple of years.

Disclaimer
This is not substantive investment research or a research recommendation, as it does not constitute substantive research or analysis. This material should be considered as general market commentary.
Leave a Reply
You must be logged in to post a comment.