Dec
2024
UK Cash Savings Surge to Record £2.05 trillion Leaving Savers Heavily Exposed to Falling Interest Rates
DIY Investor
3 December 2024
-
Cash savings have risen £51bn year-to-date to reach £2.05 trillion*
-
Cash savings are now worth 80% of UK National Debt
-
But despite high interest rates, cash has returned less than a third of that returned by stocks and shares this year
-
Savers have missed out on £165bn of returns this year by comparing cash interest and the return on global equities
-
Moreover, only £1 in £6 of cash newly deposited this year has gone into fixed term accounts – leaving savers exposed to falling interest rates
-
Over the last 30 years, cash + interest has lagged inflation by 3.4%, while global equities have risen 7-fold in real terms
-
The cost of cash is not well understood– 50% believe it is the best way to save for the long term and more believe it is a better inflation hedge than stocks and shares
Cash savings in the UK have reached a record total value of £2.05 trillion, breaching the £2 trillion mark for the first time, according to the latest annual Cost of Cash research from Janus Henderson Investment Trusts. This is up by more than £51bn since the start of 2024.
The research shows that high interest rates have been luring savers into cash accounts, despite them offering lower returns than stocks and shares investments like investment trusts.** Year-to-date, cash savings have returned less than a third of that returned by stocks and shares. Furthermore, the vast majority of cash is languishing in instant access accounts where interest income is diminishing as banks and building societies follow the Bank of England’s rate cuts. Savers are adding only a very small portion of new cash savings (just £1 in every £6) to fixed-term deposit accounts that lock in higher rates.
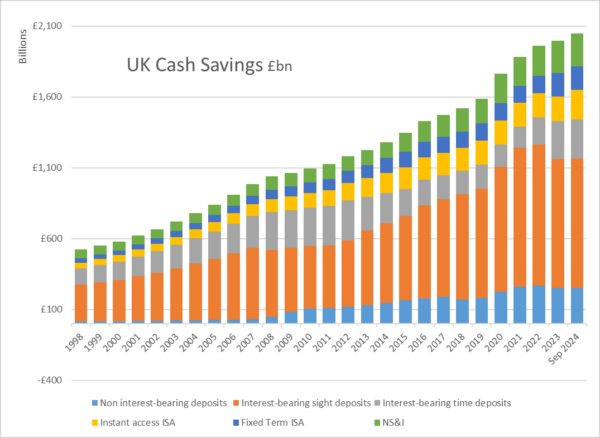
Source: Janus Henderson, Bank of England (BofE), BSA, NS&I
These are very big numbers. The table below puts the UK’s cash savings into context. For example, the UK’s instant access savings are worth more than the entire value of open-ended funds in the UK, while fixed term savings are worth 6x the value of investment trusts. As a nation our cash savings could repay 80% of the national debt.
|
Comparison |
Value |
Source |
|
Investment Trusts |
£72.8 bn |
AIC, Sep 24 |
|
Open-ended Funds |
£1,317 bn |
IA, Sep 24 |
|
UK Stock market* |
£2,509 bn |
LSE, Sep 24 |
|
UK GDP |
£2,768 bn |
ONS, Sep 24 |
|
UK National Debt |
£2,546 bn |
ONS (ex BoE) |
|
Cash Savings |
£2,049 bn |
Bank of England, Janus Henderson, NS&I, Sep 24 |
|
Of which: |
||
|
Instant access |
£1,376 bn |
As above |
|
Fixed term |
£439 bn |
As above |
|
NS&I |
£234 bn |
NS&I |
*Main market UK companies, excludes funds
Higher interest rates have not, however, delivered superior returns for investors this year. The UK’s savers earned £58.6bn in interest between January and September, equivalent to an average interest rate of 2.93%.ᐩ In the same period, the FTSE All-Share returned 9.9% in a combination of capital gains and income, while the MSCI World returned 13.4%.
Even when allowing for three months’ of household income being reserved in cash as a safety buffer, with the rest invested in stocks and shares such as investment trusts, that means the UK’s savers have missed out on £110bn of returns this year compared to investing in UK equities, or £165bn compared to investing in global equities.
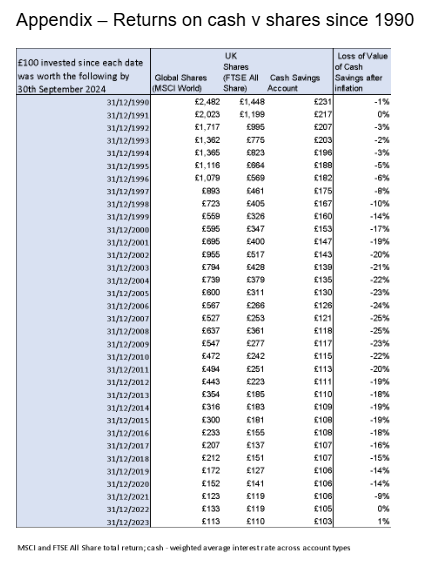
This highlights the value of investing, particularly over the long term. UK stocks have beaten cash in 22 of the last 30 years, while global equities have delivered better returns in 23 of these years. Even those who invested in a down year for equity markets would have beaten cash over the longer term. A saver who invested £100 on the 1st January in any year since at least 1990 has returned significantly more in either global or UK stocks than if they had put £100 in a savings account (see appendix). Broadly speaking longer time periods have meant bigger returns.
Moreover, if we take inflation into account, £100 saved in cash has lagged behind rising prices by 3.4% over the last 30 years*⁺, meaning it buys less today, even with all the interest income earned since, than it did in 1994. Meanwhile, £100 invested in global equities has beaten inflation almost seven fold (6.7x), with UK equities beating inflation four fold (4.0x).
While holding cash savings has its place, holding too much can pose a risk for UK savers. Just £1 in every £6 of cash saved so far this year (equivalent to £8.2bn) has been placed in a fixed-term account where interest rates can be locked in for longer. The rest is in instant access options, where rates are steadily declining. This means interest income is now falling and, although past performance is no guarantee of future returns, suggests the gap may widen further between cash and stocks and shares options like investment trusts, particularly over the longer term.
There remains much work to do to help savers understand the cost of cash. 44% said they believed cash savings accounts were the best way to save for the long term, with another 6% opting for a jar on the sideboard.*⁺⁺ Just one in eight (13%) preferred equities, including investment trusts and mutual funds, and one in 20 (5%) ultra-safe government bonds, or corporate bonds. When thinking about inflation, more people believed cash accounts would protect the real value of their nest eggs over the long term (18%) than shares or funds (15%), while 37% were unable to hazard an opinion.
Dan Howe, Head of Investment Trusts at Janus Henderson Investors, said: “UK savers are keeping an enormous amount of money in cash accounts, having added £51bn to the pot already this year. Put simply, savers are not making the most of their hard-earned cash. It’s easy to see why one might be inclined to do so – high interest rates and market uncertainty make cash savings a more appealing offer – but our research continues to show that their money could be doing more for them when invested, even in the high interest rate environment of the last few years.
“Cash savings are eroded in real terms by inflation and, as we have seen recently, are mostly sat in instant access savings accounts where interest rates continue to decline. Crucially, they tend to be outpaced by returns on equivalent equity investments, many of which also offer an additional dividend income. That is why understanding the cost of cash is so important. Beyond the recommended cash buffer, there are many opportunities for us to put our cash savings to work for us rather than letting them languish.”
*30th September, latest data available
**This year and over the longer term; past performance is no guarantee of future returns
ᐩWeighted average interest rate across interest bearing and non-interest bearing deposits, including ISAs – rates sourced from Bank of England (BoE) and BSA.
⁺⁺ Assumes surplus cash invested in equities, deducting foregone interest; source Janus Henderson, BoE, Bloomberg
*⁺Since December 1994, compared to CPI, Source ONS, Janus Henderson
*⁺⁺ 2,000 UK adults questioned on behalf of Janus Henderson Investment Trusts by Opinium between 29 October 2024 – 01 November 2024
Leave a Reply
You must be logged in to post a comment.